Complexity Cheat #02: Creating Clarity Through Visualization
Categories Case Studies and Stories from the Battlefield, Complexity, Systems Thinking, The Complexity Tool Kit
Creating Clarity
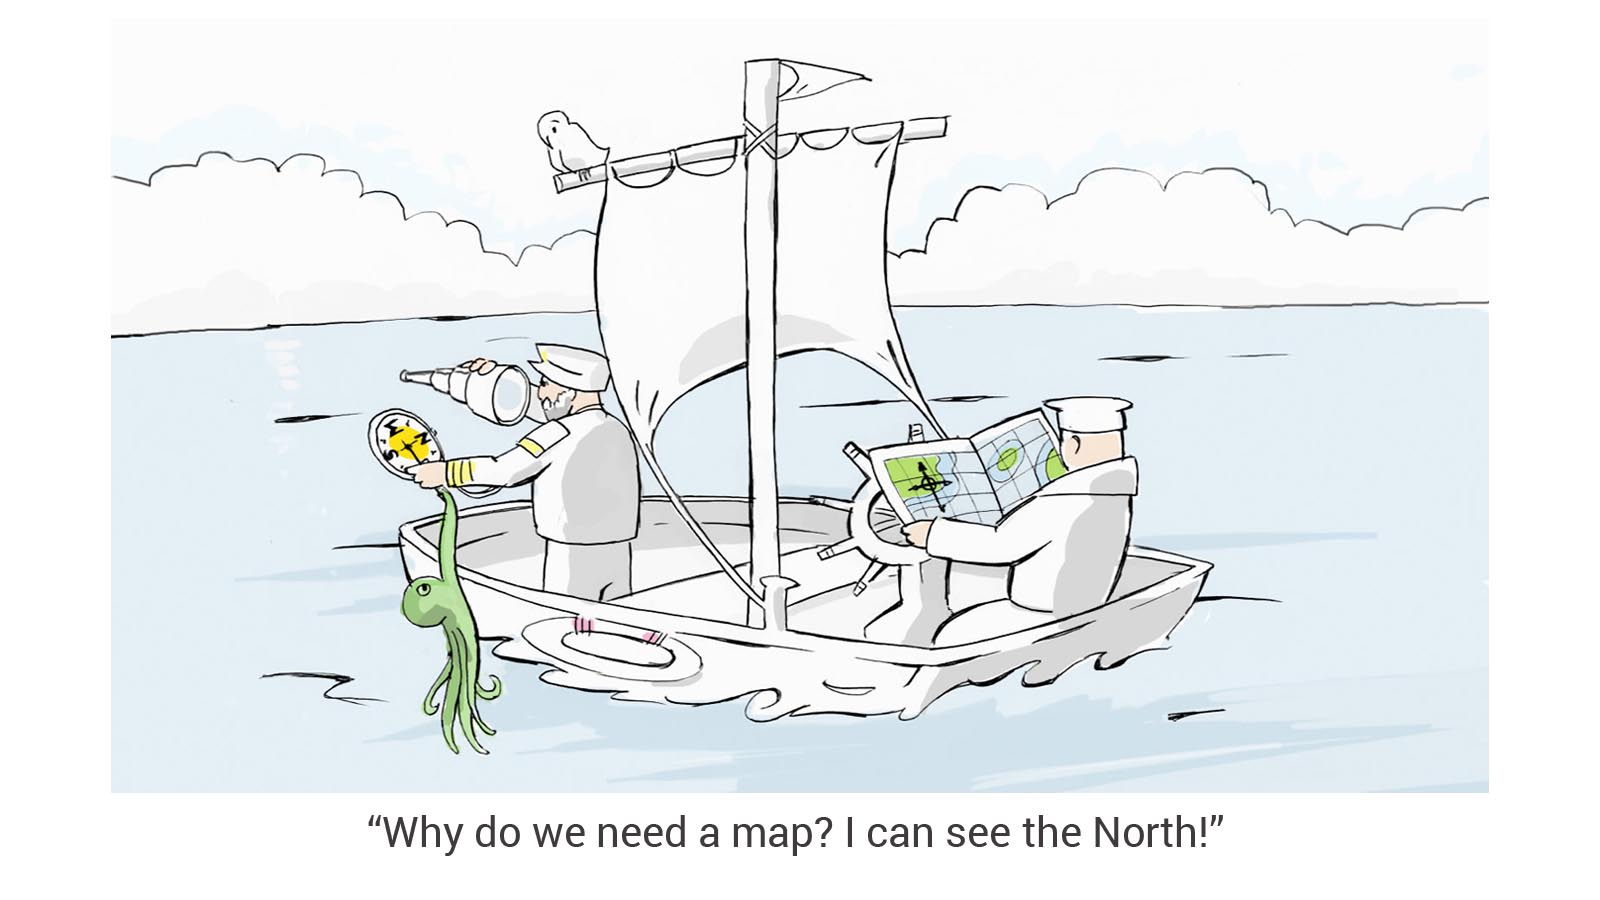
As we mentioned in our previous post, observation is crucial when we aim to gather the credible and unpolished data we need to take control of complex problems. Observing and receiving information without prejudice and being brutally honest about the information we gather allows us to avoid beautifying the situation and enables us to discover where important questions remain unanswered. When a situation is complex, however, often the information we gather doesn't immediately make a lot of sense. It might be rich, unbiased and encompasses the issue, but it is still disconnected. Therefore, the next step is to structure the information and create clarity.
A Battle Over Resources in Papua, Indonesia
A few years back I ran a training program for journalists in Indonesia. One evening an intense discussion erupted amongst the group of reporters about mining operations in Papua. Names of organizations and individuals were flying across the room, there was a heated argument about who was allied with whom and which organization owned what security sector company. After minutes I had to admit I was utterly lost and more than mildly confused. So, I interrupted the argument and asked the journalists to give me a quick run-down of the countless stakeholders involved.
While they dropped a seriously long list of unfamiliar names I begun mapping these stakeholders visually on the board, frequently asking for clarification of the relationships between particular groups or individuals. When they ran out of names, I had a fully developed stakeholder map on the board with lines and arrows indicating the relationships between the many actors involved in this particular drama.

To the surprise of the reporters I was then able to recap the entire messy situation and ask a few very pointed questions that hadn't yet occurred to any of them although they had spent months reporting on the issue.
A Picture Says More Than A Thousand Words
It is a well-known piece of wisdom that 'a picture says more than a thousand words.' Whereas words force us into dealing with information in a linear fashion - one thought after the other - a picture allows us to grasp information within its context. Captured within a visual we can look at pieces of information in a connected way, grasp the entire issue 'at a glance' and identify patterns. This is particularly valuable when your issue is a symptom of a systemic problem.
Furthermore, mapping and plotting data shows where we have gaps in our understanding. It enables us to identify which information is truly valuable and which misleading and make clear, facts-based decisions instead of following our gut feel.
I use visualization tools continuously; I draw quirky pictures when I explain complex concepts and frameworks to students, my pitch documents consist of a single sheet filled with boxes, speech bubbles and arrows, I map out intellectual property rights and joint venture contracts. And the concepts of new Strategic Nudge games fill entire walls with patterns of sticky notes.
If a problem is too complex to be held clearly in mind put it into pictures and it will make a lot more sense.
So-called 'Rich Pictures' and visual 'maps' have an additional benefit; they are a powerful tool to communicate with others involved or affected by the messy issue you are trying to tackle. Some great examples for the use of pictures to explore complex ideas can be found on Youtube - look for 'RSAnimate' or 'Sustainability Illustrated', both make some rather complex issues much more comprehensible (and fun!) using visualization.
In our next Complexity Cheat #3 Christine Baker and I will explore what to do once you feel you have gained an understanding of the issue at hand and want to start shaping the matter to your advantage. Meanwhile I suggest you start practicing some simple doodling and drawing. I promise it will pay off big time!
But before I end this post, here is - as a special treat...
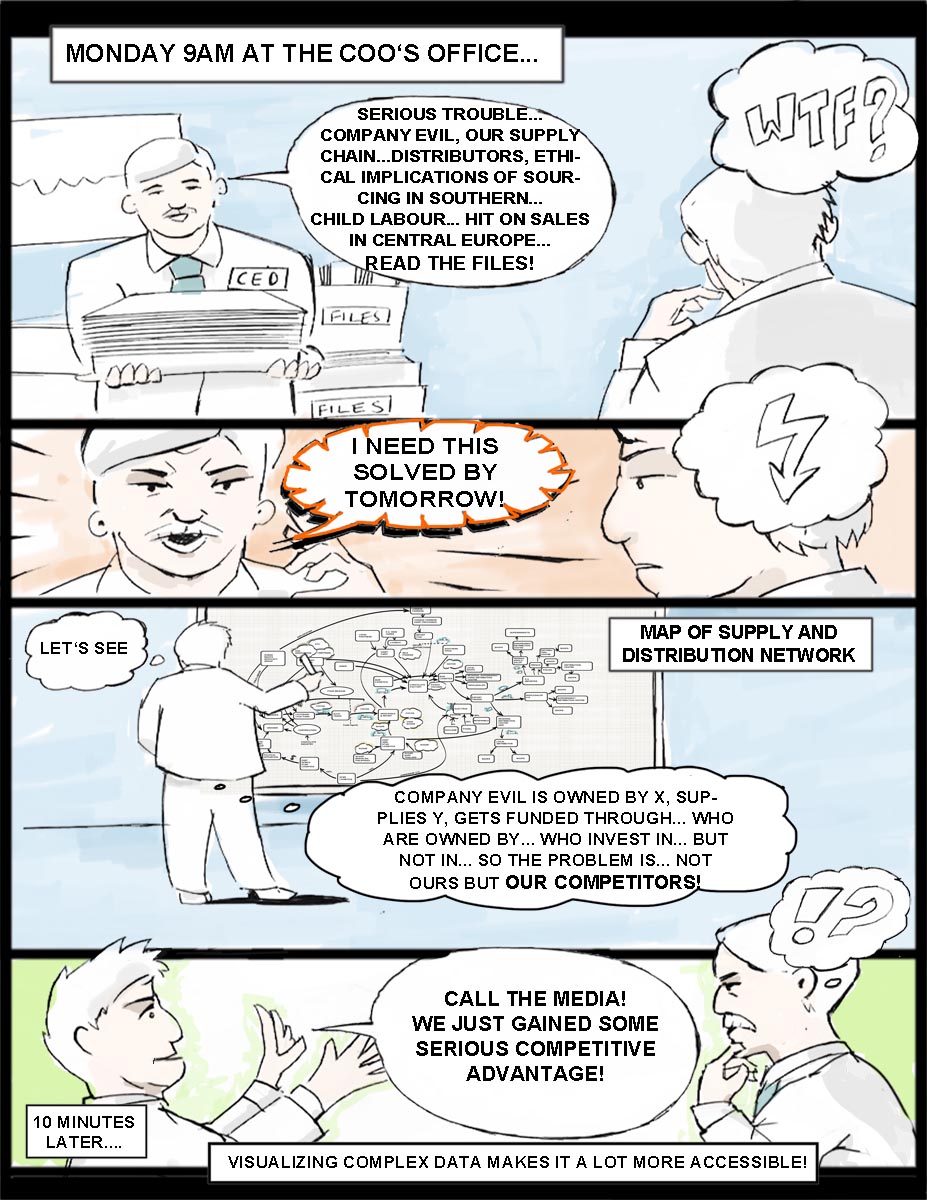
... the Benefit of Visualizing Complexity to Create Clarity in Pictures

post by Antonia Koop, visuals by Strategic Nudge's resident artist Martin Green
